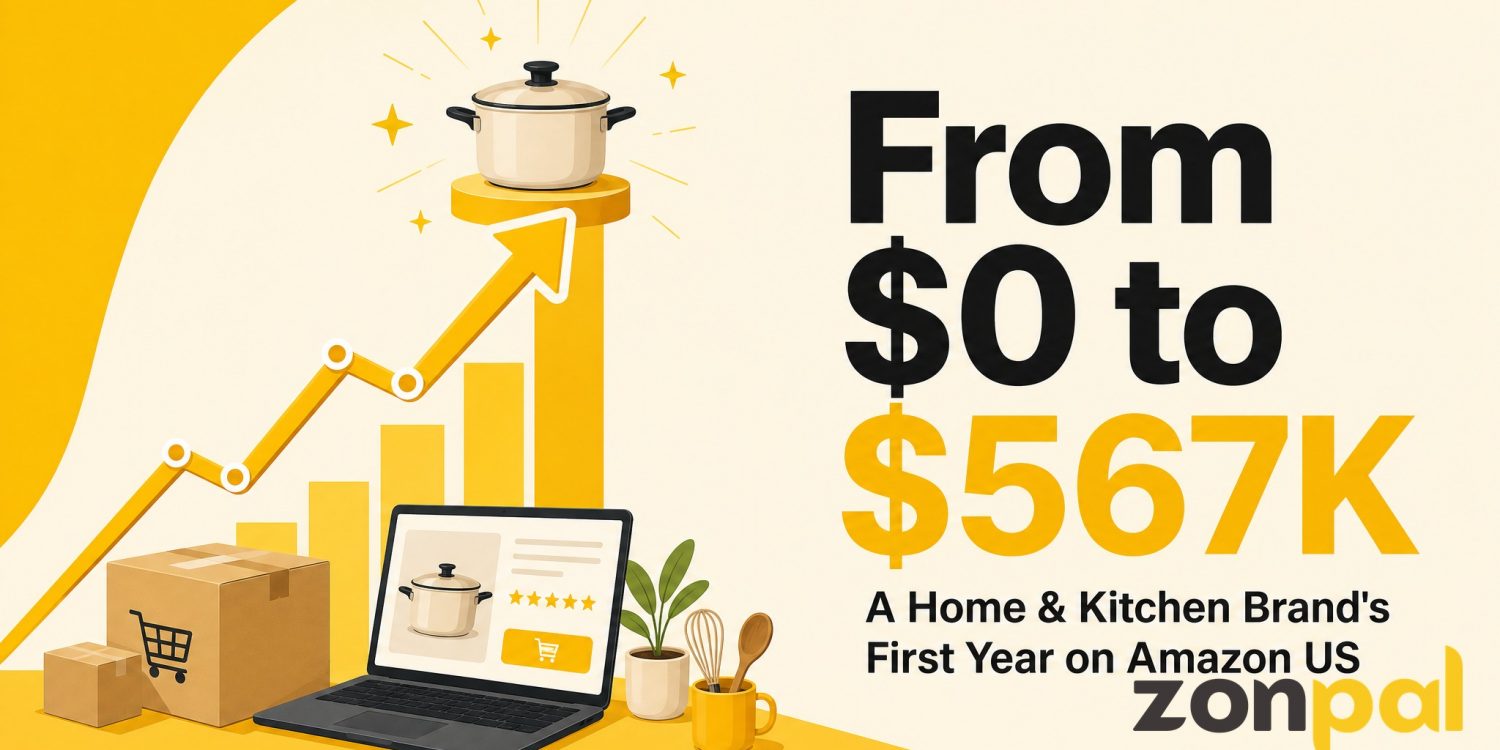
A home and kitchen brand came to us with a product line that had never been listed on Amazon. No reviews, no ranking history, no data to work from. Twelve months later, that same brand closed the year at $567K in gross revenue on Amazon US.
This is not a story about a viral product or a lucky algorithm break. It is a story about sequencing: what to fix first, what to spend on, and when to scale. If you are evaluating whether an agency partnership makes sense for your brand, this breakdown should give you a realistic picture of what that first year actually looks like.
Where the brand started
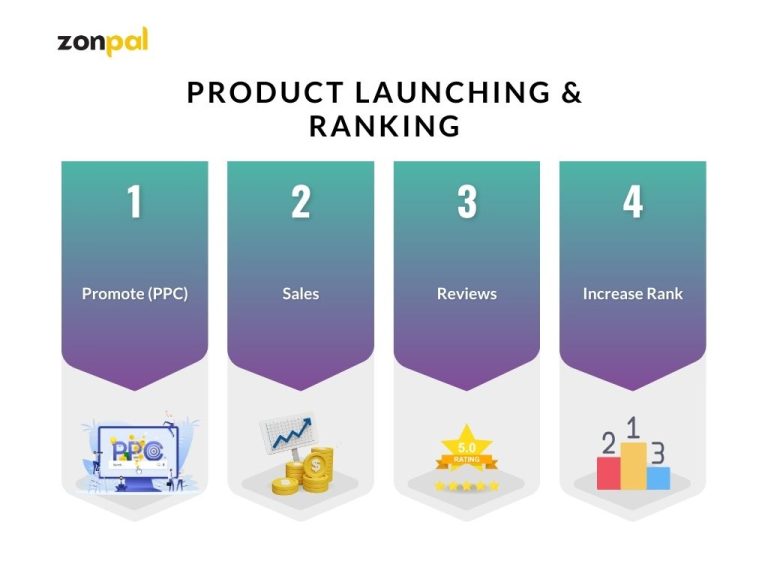
The brand had three SKUs in the home organization space: a modular drawer system, a set of stackable containers, and a smaller accessory item meant to round out the catalog. All three were manufactured and ready to ship, but nothing had been listed, no keyword research had been done, and there was no PPC account structure in place.
The founder had run a small e-commerce store on Shopify for about a year and understood the product, but Amazon was a different game. Search visibility, review velocity, and Amazon’s own ranking mechanics required a different playbook than what worked on their own site.
We started with a two-week audit phase before touching the listings. That meant competitor teardown, keyword mapping through Helium 10 and Amazon’s own search term reports, and a pricing model that accounted for FBA fees, PPC budget, and target margin. Skipping this step is the single most common mistake we see brands make when they try to launch on their own.
Building the launch foundation (Months 1-3)
The first three months were not about revenue. They were about setting up a listing and account structure that could actually rank once demand kicked in.
We rebuilt all three listings from scratch: new A+ Content, professional photography, and copy structured around the top 15-20 keywords by search volume for each SKU. For the drawer system, that meant leading with “modular closet organizer” rather than the more generic “storage drawers” the brand had been using internally, based on actual search volume data rather than assumption.
PPC launched in week three with a conservative daily budget split across three campaign types: exact-match on core keywords, a broad discovery campaign, and defensive campaigns on the two closest competitor ASINs. We kept ACoS targets loose in this phase, closer to 40-50%, because the priority was velocity and review count, not profitability yet.
By the end of month 3, the flagship SKU had crossed 40 reviews and was ranking on page 1 for two of its five target keywords. Revenue for the quarter landed just under $28K, which is roughly what we expect from a launch phase this size before the flywheel starts turning.
Scaling months 4-9
This is where most brands either compound their early investment or plateau. The difference usually comes down to how disciplined the PPC restructuring is once you have real conversion data.
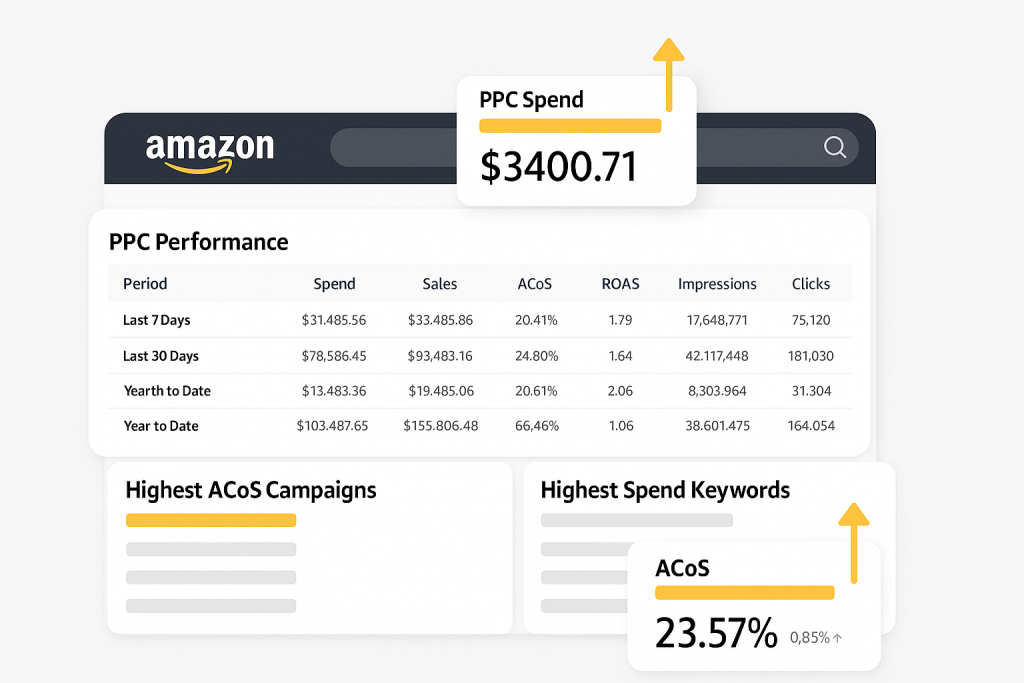
We cut the broad discovery campaigns down to their converting search terms and rebuilt them as exact-match campaigns with tighter bids. ACoS on the flagship SKU dropped from 46% in month 3 to 24% by month 6, while daily ad spend increased by roughly 60%. That combination, lower ACoS with higher spend, is the clearest signal that a listing has found product-market fit on Amazon.
We also introduced a review-generation sequence using Amazon’s Vine program for the two newer SKUs, which pushed both past the 25-review threshold within six weeks of enrollment instead of the three to four months it typically takes organically. If you’re weighing whether Vine is worth the cost for a new ASIN, this is usually the scenario where it pays off fastest: a listing with strong conversion rate but a review count too low to build trust at the point of purchase.
By month 9, all three SKUs were profitable on a contribution margin basis, and the brand had expanded from three to five SKUs by adding two color variants of the best-selling drawer system, using the same listing template and PPC structure we’d already validated.
The results after 12 months
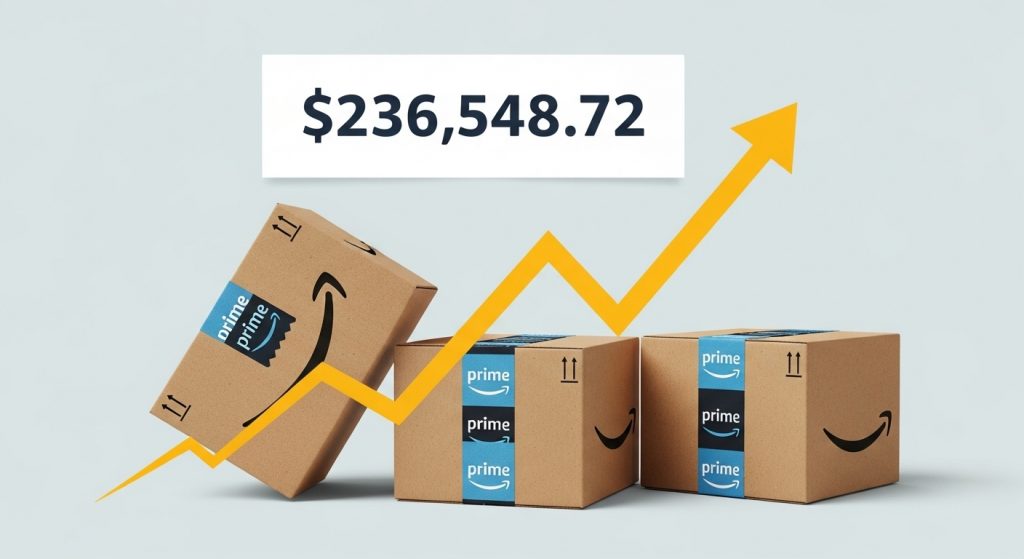
By the end of month 12, the brand closed at $567K in gross Amazon US revenue across five active SKUs. Monthly revenue in the final quarter averaged around $68K, up from roughly $9K in the first quarter.
Blended ACoS across the account settled at 19%, down from the 40-50% range we ran during launch. Organic ranking accounted for close to 55% of total unit sales by month 12, meaning the brand was no longer entirely dependent on ad spend to move product, which is the real marker of a sustainable Amazon business rather than a rented one.
Review count on the flagship SKU crossed 210 by year end, with an average rating of 4.6 stars. None of this happened in a straight line. Month 5 saw a dip when a competitor undercut pricing by nearly 20%, and we had to adjust the bid strategy and run a short-term coupon to hold rank without matching the price cut dollar for dollar.
What actually moved the needle
Looking back at the full year, three decisions mattered more than anything else:
- Not launching PPC blind. The keyword mapping done before the listings went live meant every dollar of ad spend from day one was pointed at search terms we already knew converted, based on competitor data.
- Restructuring campaigns at the right moment. Waiting until month 4 to tighten PPC, rather than doing it too early, gave us enough conversion data to make confident decisions instead of guesses.
- Expanding only after profitability, not before. The two additional SKUs launched in month 9 only happened once the original three were consistently profitable, which meant the new listings had a working template rather than starting from zero.
We’ve written more about how we approach PPC restructuring in our guide to Amazon PPC management, which covers the exact campaign types we used in months 1 through 6 of this case.
How to know if an agency partnership is the right move
If you’re weighing whether to bring in outside help versus running Amazon in-house, here’s the checklist we’d recommend running your brand through before deciding:
- Do you have the internal bandwidth to manage PPC weekly? Campaigns that aren’t reviewed at least weekly in the first 90 days tend to bleed ad spend on underperforming keywords.
- Can you commit to a 90-day runway before expecting profitability? Brands that pull budget or attention after month one rarely give the flywheel time to start.
- Is your pricing model built around real FBA fees and target ACoS, not guesswork? This is the single most common gap we find in brands that come to us after a failed self-managed launch.
- Does the agency show you account-level data, not just summary reports? If you can’t see the actual campaign structure and keyword performance, you can’t evaluate whether the strategy makes sense for your brand.
If your brand can check most of those boxes on its own, an in-house approach might work. If any of them feel uncertain, that’s usually a sign an experienced partner will get you to profitability faster than trial and error will.
Final thoughts
A $567K first year didn’t come from one good decision. It came from sequencing: audit before launch, patience before scale, and expansion only after the foundation was proven profitable. That’s the same framework we run for every brand’s first year on Amazon, regardless of category.
If you want to see how this plays out across other categories and starting points, we’ve put together a full set of Amazon FBA case studies covering different brand sizes and launch scenarios. It’s a useful next step if you’re trying to picture what your own first year could look like.